
")
First, let’s take a look at common trading jargon. It is not important for you to memorize all of them as they will become familiar over time as you study more tutorials and interact with many other traders. However, it is necessary to go over them once to ensure you are not lost when you come across a new term.
Arbitrage
A method of making profit using the price difference between exchanges.
Accumulation
The process by which one builds a position in an asset.
Altcoin
All coins except Bitcoin.
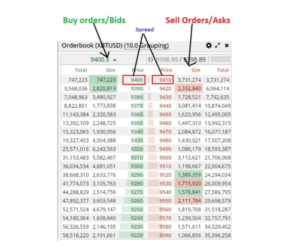
Ask/Bid
Sell orders are asks and buy orders are bids.
ATH (All-Time High)
The highest price ever reached by an asset.
Bearish Market Structure (MS)
When the price makes a series of lower lows and lower highs.
Bearish Market Structure Break (MSB) or Break of Structure (BOS)
When the price takes out a low to form a lower low, resulting in a bearish break of structure.
Bots
Automated trading set-ups on exchanges.
Bull
Someone expecting the price to go higher. The opposite of a bear.
Bullish Market Structure (MS)
When the price makes a series of higher highs and higher lows.
Bullish Market Structure Break (MSB) or Break of Structure (BOS)
When the price takes out a high to form a higher high, indicating a bullish break of structure.
Bull Market
A market where prices see a continuous uptrend, leading to new highs being created.
Bull Trap
A technique used by market makers to buy a huge amount suddenly, spiking the price.
Bubble
A situation where prices are irrationally high compared to the actual value of the asset.
Bag
A position held in any asset or coin.
Bag Holder
Someone holding a coin at a loss.
Bear Trap
Market makers sell enormous amounts, pushing prices down, liquidating those who had bought, causing a cascading effect of liquidations.
CHOCH (Change of Character)
The first switch turning the substructure from bullish to bearish or bearish to bullish.
CMP (Current Market Price)
The current price at which an asset is trading.
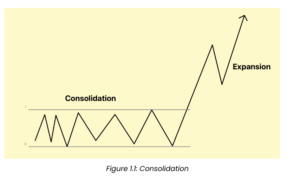
Consolidation
A period where the price is ranging in a well-defined region.
Correction
A fall in price after making a new peak or an upward rally.
Day Trading
Taking a position in the market and exiting it the same day.
Deep Swings
A deep swing high is the highest point that causes the swing low, and a deep swing low is the lowest point that causes a swing high.
Depth of Market (DOM)
A list/window showing how many open limit buy and limit sell orders there are at different prices in real-time.
Deviation
When the price goes below the support but reverses, or the same happens with resistance.
Downtrend
A price trend characterized by lower highs and lower lows.
Exchange
In terms of crypto, a marketplace that allows the buying and selling of Bitcoin and other coins.
FIB Levels (Fibonacci Levels)
Specific levels from swing point to swing point representing percentages. Price often reacts at these levels.
FOMO (Fear of Missing Out)
A behavior where traders enter a trade without enough research due to the fear of missing out on profits.
FUD (Fear, Uncertainty, and Doubt)
Negative sentiments or misinformation affecting market sentiment.
Fractal
A pattern of price movement that has occurred earlier and might occur again.
FTA (First Trouble Area)
An area where the price might be rejected before reaching the target.
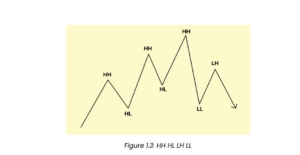
HH (Higher High)
When the price makes a new high higher than the previous high.
HL (Higher Low)
When the price makes a new low higher than the previous low.
LH (Lower High)
When the price makes a new high lower than the previous high.
LL (Lower Low)
When the price makes a new low lower than the previous low.
HTF (Higher Time Frame)
Longer time frames in trading, typically above 4 hours.
LIQ (Liquidity)
How quickly an asset or coin can be bought or sold without moving the price too much.
Laddering
Placing multiple buy or sell orders to enter a trade setup and get an average entry price.
Leverage
Refers to the extra amount of an asset bought or sold over your capital.
Long Position
A buy position with leverage.
LTF (Lower Time Frame)
Shorter time frames in trading, usually anything under 4 hours.
Margin
The amount of funds required to open a leveraged trade.
Market Cap (Market Capitalization)
The market value of an asset calculated by the current supply of coins multiplied by the current market price of one coin.
Market Maker (MM)
An individual or firm that can cause large swings in price due to an overwhelming position size.
MS (Market Structure)
Defines the structure that the current market is trading in.
Pattern
A chart pattern is a predefined shape that has been historically studied by technicians. Traders use these previous performance statistics to predict future price movements.
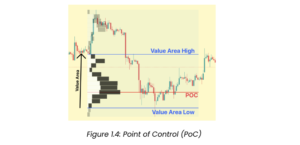
Point of Control (POC)
The price level for the time period with the highest traded volume.
Positional Trading
The aim is to buy monthly lows and hold them for days, weeks, or sometimes months. This is a longer-term trading time period.
Rally
An upward trend leading to an increase in the price of the asset, can happen in both bear and bull markets.
Return-on-Equity (ROE)
Calculated by the actual capital employed in a trade, not through leverage.
R
(Risk to Reward Ratio)
A ratio that measures the potential risk and reward in a trade. For example, a 2:1 R
can simply be called 2R.
Sell-Off
Profit-taking after a rally in price, which leads to a lowering of the asset’s price.
Short Position
The opposite of a long entry. You enter a short position when you expect the prices to fall.
Sideways Market
An indecisive market that isn’t leading to a breakdown or a breakout.
Spread
The difference between what sellers are ready to sell at and what buyers are ready to buy at. Higher liquidity usually results in a lower spread.
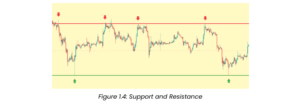
Support and Resistance
A support is a zone or line (often green) where the price is expected to bounce back. Resistance (often red) is a line or zone where the price is expected to rebound downwards.
Stop Loss
An order triggered when the price goes below a certain point, used to cut losses.
Swing Trade
A method that looks for buying and selling positions in a weekly range. Swing traders make 2-3 trades a week.
Time Period / Time Frame
The time spread of each candle in a chart. Common time periods are 15 minutes, 30 minutes, 1 hour, 4 hours, daily, and so on. For example, in a 15-minute time frame, a candle will take 15 minutes to close.
Total Supply
The amount limit of coins that will ever exist.
Trading Charts
Where to see them? There are several websites, but a popular choice is TradingView. Simple, easy, and offers everything most people need. The basic free version is enough.
Uptrend
A price is said to be in an uptrend when it is making higher highs and higher lows.
Value Area
The range of price levels in which a specified percentage of all volume was traded during the time period. Typically, this percentage is set to 70%, but some use 68%.
Value Area Low (VAL)
The lowest price level within the value area.
Value Area High (VAH)
The highest price level within the value area.
Volatility
The percentage movement in the price of an asset over a period.
Volume Weighted Average Price (VWAP)
Incorporates price and volume. It is a support/resistance line. When the price is above VWAP, it is above value, and when it is below, it is below value.
Walls
Extremely large orders at a range.


